[Analysis] Weather analysis
Crossing data from Météo_France
Ludovic Moisan
2022-06-29
Analysis_Weather_analysis.RmdTag use
In order to determine the accuracy of the manually selected tags by the users of the NoiseCapture app, we want to proceed simple investigations concerning some tags that concern physical events, such as the weather related ones (rain,wind), which can be verified later on.
The verification of such data require historical data weather. Staying true to the opendata mindset, we decided not to use any paying API to recover such intel based on our own data location, but rather use free datasets available online and create our own functions to retrieve weather details.
In order to get valuable data, we decided to focus on tracks from France, for both its readily and furnished weather data online and its amount of tracks in our database.
The weather data used is from France’s national weather organisation Météo-France, available along with its full documentation from their website : French weather data
It is to keep in mind that the weather data available to us via this method is limited to the one measured at weather stations. We coded a function getting the weather observed at the closest station. The median distance between stations and our tracks is 16.21 kilometers, resulting in a small margin of error, the weather being susceptible to change on such a distance.
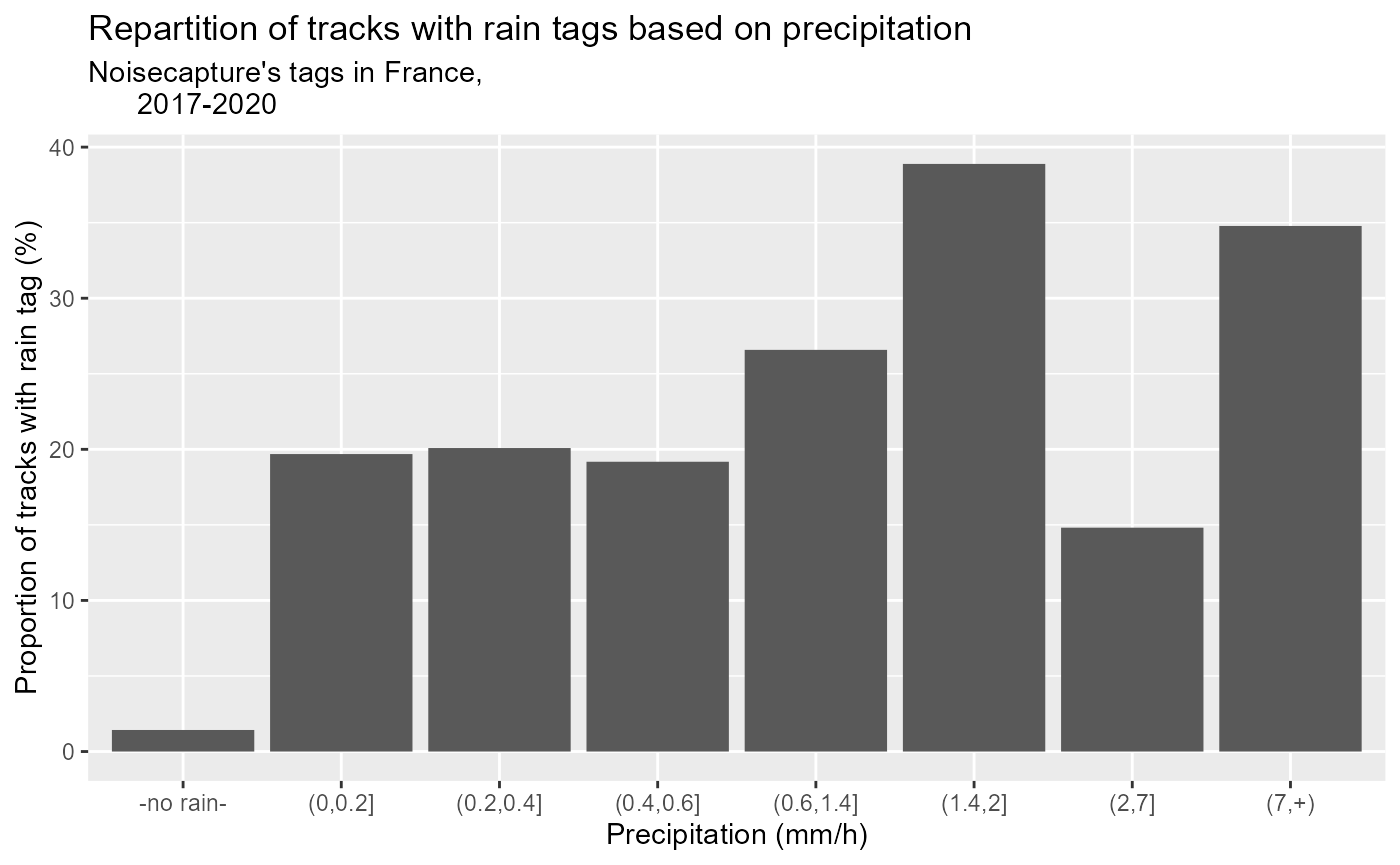
Figure 1: Rain tag use by actual rain measures
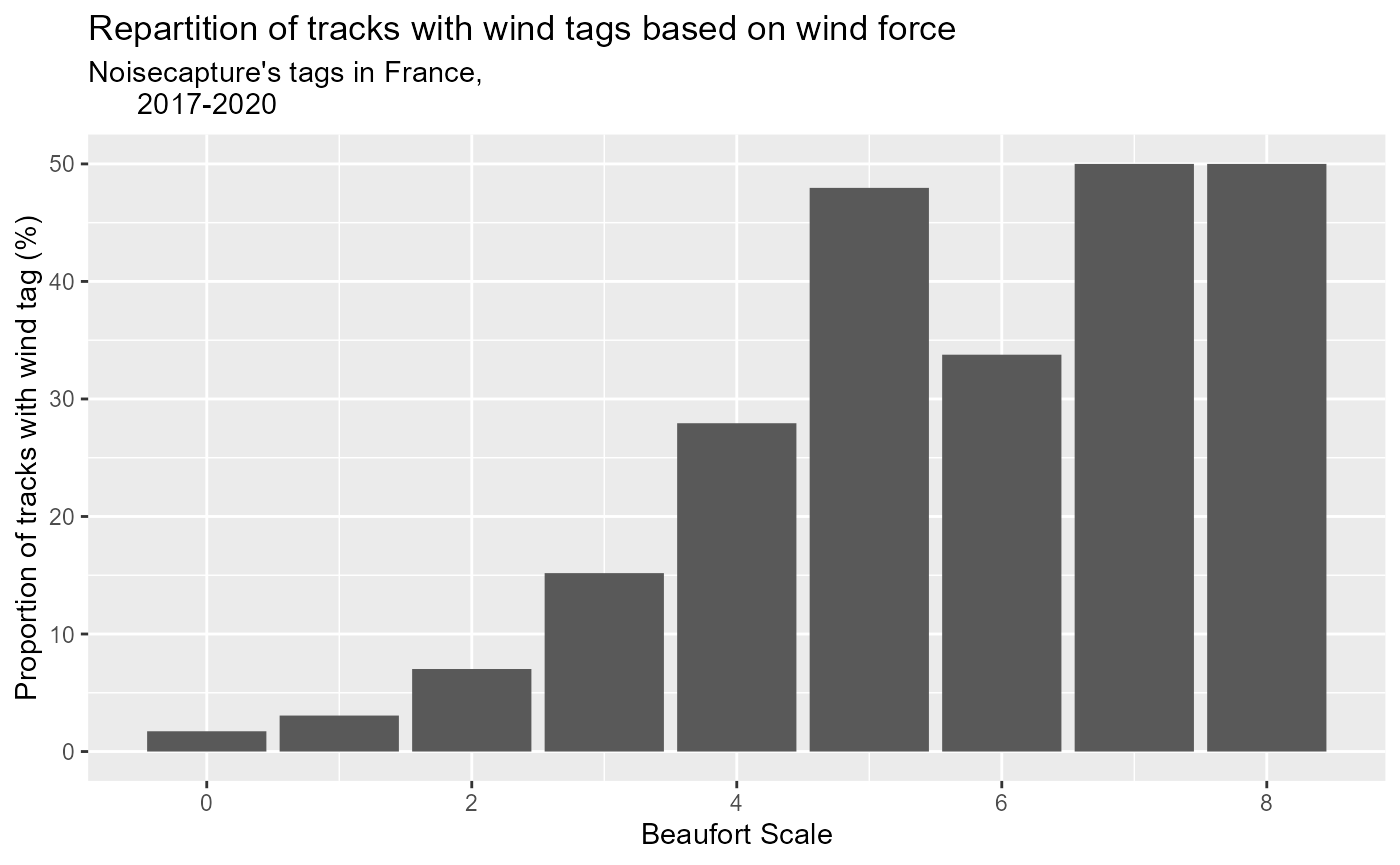
Figure 2: Wind tag use by actual wind measures
In order to create those graphs, we selected scales to group our data (wind force and precipitation) and calculate the proportion of tags present in those groups. We tried to create groups of equal representation for our data, but our data being non-uniform and disparate, some of our groups of data are much less populated than others, creating a potential bias that could only be corrected by the aggregation of more participator’s data.
The correlation coefficient between rain tags and the amount of rain is estimated at 0.5238095 with a p-value of 0.196627.
The correlation coefficient between wind tags and the strength of wind is estimated at 0.9790881 with a p-value of 4.2663224^{-6}.
Both correlation calculation were carried by a Spearman’s rank correlation rho at a 0.95 confidence level.
The proportion of “wind” tags seem to strongly correlate with the strength of wind on a Beaufort scale. However, the correlation between “rain” tags and the presence of rain is more subtle. The graph shows us that the “rain” tags seem rather equivalently used whatever the strength of the rain is, but that it is not used when there is no rain falling. Given this, even though the rain’s correlation score is lower that the wind’s one, they both tend to indicate that the use of these tags are coherent with their environment, and that only their usage in term of proportion differ.
For the rain data, 72.7% of rains are being tagged as rain. The
quantile (10% increments) of measured rainfall (mm/h) not tagged as
“rain” by users is as follows :
0%, 10%, 20%, 30%, 40%, 50%, 60%, 70%, 80%, 90%, 100%
0.2, 0.2, 0.2, 0.2, 0.2, 0.4, 0.4, 0.6, 1.4, 2.6, 40.7